WEATHER DATA
Weather is the condition of the atmosphere at a specific location at a certain time. It consists of temperature (dry-bulb, wet-bulb and dew-point), barometric pressure, wind speed and direction, humidity, cloud cover and precipitation (amount of rain and snow)
Location: Locations are established by latitude, longitude and elevation. Locations have to be associated and identified by the nearest weather measuring station. This is usually the nearest airport to the location. Example, Phoenix AP, Arizona. AP stands for Airport. All airports have a weather station since this information is required by arriving and departing airplanes. Most cities have just the one weather station at the airport. There can be a considerable difference between the weather conditions in the city and the airport which is located in a flat open area with few buildings around it. In large cities such as Chicago, there is a weather data measuring station located midtown besides it's local airports O'Hare (20 miles west) and Midway (15 miles southwest). In the case of Chicago, the weather conditions downtown are affected by not only the mass of steel and concrete buildings, roads and pollution levels, but also by the Michigan Lake temperatures and the wind effects off the lake. Downtown Chicago located near the lake can have DB temps 5oF to 15oF higher than the airport in winter and 5oF to 15oF lower in summer.
Latitude: Latitudes vary from 0o (equator) to 90oN (North Pole) in the northern hemisphere and from 0o (equator) to 90oS (South Pole) in the southern hemisphere. The absolute values of solar radiation intensity at a location depends on the latitude and the time (day, hour, minute, second) of the year. It has nothing to do with weather conditions. However, the actual solar radiation reaching a location depends on altitude (the air is thinner), weather (cloud cover, rain, snow, fog) and atmospheric pollution (smog).
Longitude: Longitudes vary from 0o to 180o West of Greenwich, London, UK (considered 0o longitude), and 0o to 180o East of Greenwich. In the USA, longitudes west of Greenwich are considered positive and east longitudes are considered negative. This should be considered when using energy computer programs developed in countries east of Greenwich where east longitudes might be considered positive. Since the earth is a sphere (360o circle along lines of latitude) and there are 24 hours per day, there is a change of 1 hour for every 15o change in longitude (360/24 = 15). The International Date Line (180o East or 180o West longitude) passes mainly over the Pacific Ocean. It is bent around the few small islands that it might split. Longitude affects the time of the day only and not the weather.

Figure
Elevation: Elevation or Altitude is measured above sea level. This assumes that all inhabited land is above sea level. Typically the atmospheric air pressure, air density, air temperature, cloud cover, and air oxygen content per cubic feet decreases with altitude. There are cities that are located at elevations up to 15,000 feet. The highest land elevation is Mount Everest at an elevation of over 29,000 feet.
Standard engineering data-charts and equipment performance data published by manufacturers are for equipment operation at sea level (zero altitude). When the building project is located at higher elevations, corrections to standard equipment performance data must be made if it involves air and combustion processes. Approximate correction factors for elevation are:
| Elevation (feet) | 0 | 2500 | 5000 | 7500 | 10000 |
| Compressors, Chillers | 1.0 | 1.0 | 1.0 | 1.0 | 1.0 |
| Air-Cooled Condensers | 1.0 | 0.95 | 0.90 | 0.85 | 0.80 |
| Induction Air Terminals | 1.0 | 0.93 | 0.86 | 0.80 | 0.74 |
| Fan Coil Units | 1.0 | 0.93 | 0.86 | 0.79 | 0.73 |
| Evaporative Condensers | 1.0 | 1.00 | 1.01 | 1.02 | 1.03 |
Note that compressors and chillers are not affected since the process consists of refrigerant moving in a closed system that does not involve air and is not open to the atmosphere. Equipment involving air movement and open to the atmosphere is affected. Their performance capacities are reduced. Equipment that depends on water evaporation processes, such as cooling towers and evaporative condensers are not affected.
Humidity
This is the amount of water vapor in the air. Although this amount is relatively miniscule compared to the remaining mass of air, it is a critical factor in describing weather and comfort conditions. The common terms used are: (1) Absolute Humidity which is the mass of water vapor per unit volume of air, (2) Relative Humidity which ca be described as the percent ratio of the moisture in the air to the maximum amount it can hold at the same DB temperature, and (3) Specific Humidity which is the mass of water vapor per unit mass of air
Air conditioning calculations are therefore based on absolute humidity and specific humidity of air. Humidity is measured with a hygrometer. The most widely used method for measuring humidity is a dry-wet-bulb psychrometer. Humidity is than calculated from the dry and wet bulb temperature condition.
The rate of evaporation decreases as the moisture content of the air increases and approaches saturation. In addition, the saturation point (moisture-holding capacity of the air) increases rapidly as the temperature of the air rises. Thus cold air, while its moisture content is necessarily quite low (low absolute humidity), may be almost saturated with respect to the maximum amount of water vapor it is capable of holding (high relative humidity).
Cold air with high relative humidity "feels" colder than dry air of the same temperature because high humidity in cold weather increases the conduction of heat from the body. Conversely, hot air attended by high relative humidity "feels" warmer than it actually is because of an increased conduction of heat to the body combined with a lessening of the cooling effect afforded by evaporation. On the other hand, a low relative humidity "modifies" the effect of temperature extremes on the human body. Humidity decreases with altitude. Proximity to large bodies of water and the prevalence of moisture-bearing winds favor high humidity.
A temperature-humidity index has been developed by the U.S. National Weather Service that gives a single numerical value in the general range of 70 to 80 reflecting the outdoor atmospheric conditions of temperature and humidity as a measure of comfort (or discomfort) during warm weather. The temperature-humidity index, ITH, is defined as follows: ITH=0.4 (dry-bulb thermometer temperature F + wet-bulb thermometer temperature F) + 15.
ITH = 0.4 * ( DB + WB ) + 15
When the Index is 70 most people feel comfortable; at 75 about half the population is uncomfortable; at 80 most are uncomfortable.
Ex1: DB = 98, WB = 59, (RH = 5%), ITH = 78 (Dry Outdoor Conditions)
Ex2: DB = 98, WB = 98, (RH = 100%), ITH = 94 (Humid Outdoor Conditions)
Ex3: DB = 95, WB = 78, (RH = 47%), ITH = 84 (Typical Chicago Outdoor Design Conditions)
Ex4: DB = 75, WB = 62, (RH = 50%), ITH = 70 (Typical Indoor Design Comfort Conditions)
Wind
Wind is air in motion relative to the surface of the earth. Since vertical components of atmospheric motion are relatively small, especially near the surface of the earth, meteorologists use the term to denote almost exclusively the horizontal component. Vertical winds are usually identified as such. Surface winds are measured by anemometer and wind vane. Winds in the upper atmosphere by such systems as pilot balloon or aircraft navigational techniques.
The greater the difference in pressure between a location and it's surrounding areas the stronger the wind velocity. Direction is determined by the relative location direction of the high pressure areas. The direction of the wind is not always the same near the surface of the earth as it is some miles above the earth. In some locations the direction can vary considerably during the course of a day and from day to day and over the seasons.
The U.S. Weather Bureau uses numbers from 0 to 12 to categorize wind velocities.
| 0 = Calm (< 1 mph) | 1 = Light Breeze | 3 = Gentle Breeze |
| 4 = Moderate Breeze | 5 = Fresh Breeze | 6 = Strong Breeze |
| 7 = Near Gale Force | 8 = Gale Force | 9 = Strong Gale Force |
| 10 = Storm Winds | 11 = Violent Storm Winds | 12 = Hurricane (over 70 mph) |
It is difficult for humans of average size to stand up to wind velocities of over 60 mph. Tornado winds have reached 500 mph.
Since the earth rotates anti-clockwise on it's axis from East to West, relatively the weather conditions generally move from West East. Another factor to consider is the effect of the oceans. Warm currents flow north from the equator along both sides of the Atlantic Ocean creating moderate winter climates as far north as Iceland and northern Scotland. Similarly cold currents from the north wash the northwest coasts of America (Ex. Vancouver Canada and Seattle USA) creating moderate summer and winter climates in these regions.
Precipitation
This is a term used to describe Rain, Snow and Sleet (mixture of rain, snow and ice). Rain is measured in inches and snow is measured in feet. Snow is not ice and a foot of snow when melted translates approximately into an inch of water. Annual rainfall in the United States varies from less than 2 inches in Death Valley to 100 inches along the northwest coasts. Building and Municipal storm water drainage and removal systems have to consider annual rainfall statistics and more importantly peak rainfall which can sometimes reach 7 inches per hour. Elsewhere in the world in the lower mountains of the Himalayas in northeastern India, the average annual rainfall is about 900 inches and the record rainfall is 1500 inches. Almost all of this rain falls within the monsoon season of about 4 months.
Clouds
Cloud Cover (CC) or Sky Cover (SC) has a major impact on summer cooling energy loads. Cloud cover is rated on a scale of 0 to 10 with 0 representing clear skies (no clouds) and 10 representing 100% cloud cover (direct solar radiation is zero, but there is diffuse/scattered solar radiation). Generally, cloud cover is 10 or near 10 when it is raining or snowing.
In regions with humid climates there are more clouds than in areas with hot dry air such as desert regions. There are four types of clouds: (1) Cumulus clouds occur on hot summer afternoons. The bottom of the clouds is about 2,000 to 4,000 feet above ground and the top may be up to 15,000 to 20,000 feet. They may turn into clouds that bring rain; (2) Nimbus clouds are thick and dark from which rain or snow falls. They are generally not more than 3,000 feet above ground; (3) Cirrus clouds are very high above ground. They are light and white and generally do not bring rain; and (4) Stratus clouds are close to ground and they denote stormy weather.
Lightning is an electrical discharge that commonly occurs during thunderstorms. The discharge may take place between one part of a cloud and another part of a cloud, or between one cloud and another cloud, or between a cloud and the earth. In general there are four types of lightning. They are: (1) Forked lightning that appears as a jagged streak; (2) Sheet lightning that occurs as a vast flash in the sky; (3) Ball lightning that appears as a ball of illumination; and (4) Heat lightning that occurs near the horizon, often with clear skies overhead. Buildings have to be protected with lightning rods located at the highest point, which conducts the electrical charge away from the building and it's contents into the earth.
Weather Data Categories:
The two types of weather data formats used are:
(1) Design Day Weather for building loads calculations and equipment selection
(2) Hourly Weather Data for energy analysis.
The first consists of a typical hot summer day and a typical cold winter day and is referred to as design weather. The second consists of 8760 hours (365 days x 24 hours/day) of weather data for a full year.
DesignWeather Data
This consists of outdoor air peak conditions during a typical hour in summer and a typical hour in winter. The hour is usually estimated based on the location.
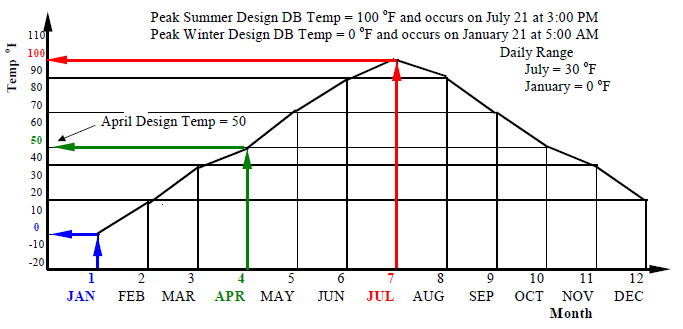
For a location such as Chicago, the peak summer temperatures are estimated as occurring at 3:00 PM or 4:00 PM on the 21st day of July, and the peak winter temperatures are estimated as occurring at 5:00 AM on the 21st day of January. Note the time lag of one month difference of solar peaks from 21st June and 21st December. The hottest day in summer can also occur in August or a time lag of 2 months. In summer there is also a time lag for the peak hour as well, which occurs after the sun reaches it's maximum altitude at 12 noon. And when the absolute solar radiation intensity is maximum This time lag is usually estimated as being between 3 to 5 hours.
Another summer design day condition that is required is the daily range. This is used to determine the remaining temperatures for the day. The lowest temperatures of the day are assumed to occur just before sunrise. Sunrise and sunset hours vary for each day of the year. The daily range value is assumed to diminish from a peak on the summer design day to zero on the winter design day.
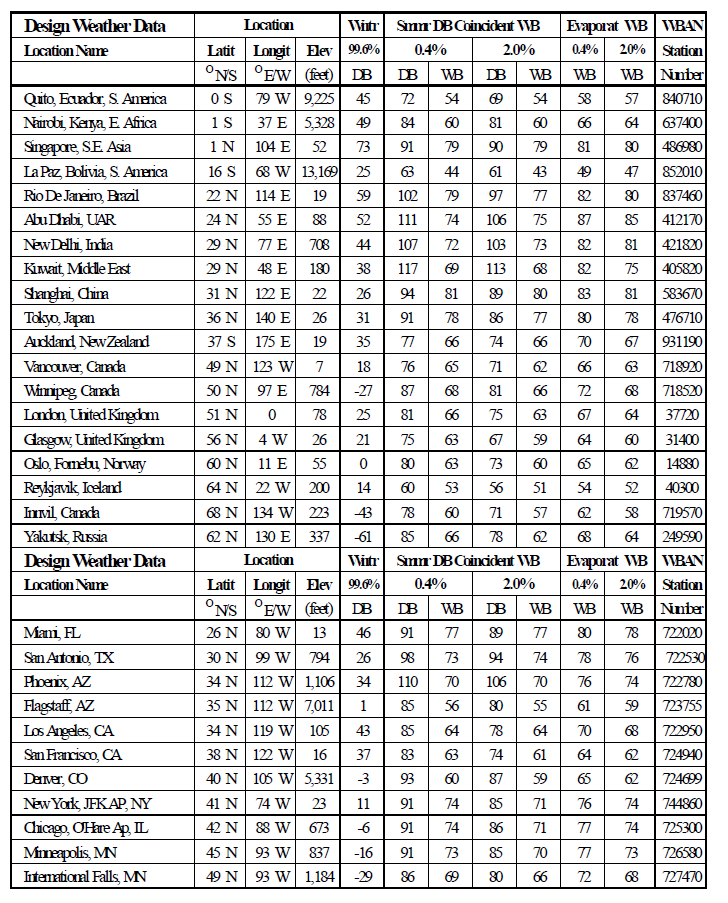
The table below was extracted from ASHRAE Fundamentals Handbook. It shows outdoor design conditions in various locations around the world. The locations are listed in ascending latitudes. Note that weather conditions are affected by several other factors besides the latitude. These include altitude, location near oceans and also ocean currents along the coast line.
99.6% Winter Design DB Temp means that the winter temperatures in a typical year for that location will exceed this design value about 0.4% of the time. ASHRAE also lists 99% and 95% winter design conditions. The use of 99.6% winter design conditions is recommended. For example, 99.6% winter design temperature for Minneapolis is -16oF. However during unusually extreme winter conditions the temperature can drop to -40oF. If the heating capacity is inadequate to meet this condition the occupants cannot function in the building. At - 40oF the inside surface temperatures of exterior walls and windows are not going to be at the room design temperature of say 75oF. Radiant heat loss between the occupant and the surface can cause discomfort unless perimeter radiation heat is provided to heat the surfaces. At conditions other than winter design, the heating equipment is operating at part load that varies from 0% to 100% (at winter design).
Figure
Summer Design conditions are given as DB Temp and Mean Coincident WB Temp. The highest DB Temp and the highest WB Temp will rarely occur at the same time. WB Temp is indicative of the moisture content and total heat content of the air. 0.4% Summer Design DB and coincident WB Temps mean that the summer temperatures in a typical year for that location will exceed this design value about 0.4% of the time.
ASHRAE also lists 2% and 5% design conditions. Common practice is to use the less stringent conditions since occupants can function in the building if indoor design comfort conditions are exceeded. They are also willing to tolerate such conditions for short intervals. Also, unlike winter heat equipment, the efficiency of cooling equipment decreases with increasing part load conditions.
The daily temperature range is considered in designing the HVAC equipment and control systems and also the architectural and structural envelope of the building. For example if a location has a daily range of 50oF from 120oF to 70oF as is the case of some desert climates, the density and thickness of the building shell can help reduce the swing in temperatures within the enclosure. For example as the temperature outside swings from 120oF to 70oF, the temperatures inside would swing from say 105oF to 85oF because of the storage effect of the thermal mass of the shell/
0.4% Summer Evaporation Design WB Temps means that the summer WB temperatures in a typical year for that location will exceed this design value about 0.4% of the time. This WB temperature is considered or measured independently of the DB temperatures. This condition is used to size evaporative cooling equipment such as air-cooled condensers and cooling towers. Evaporative cooling capacities decrease with increasing WB or DP temperatures. ASHRAE also lists 2% and 5% design conditions. However, normal practice is to use 0.4% conditions.
Selection of design conditions depends on the type of building and the use of the building. For example, if the cost budget for building construction and operation is small, then the weather data would be based on average conditions and not extreme weather conditions which would require larger heating and cooling equipment.
Prevailing winds (direction and velocity) are also listed in design conditions for various locations. This affects outdoor air infiltration into the building. In calculating design loads, assume the highest design wind velocity (selected from all wind directions) applies to all building walls and windows in determining infiltration. Infiltration rates depend on the type of building materials used, the quality of construction and the operation of the building windows and doors. Although estimating methods are available for determining air infiltration into buildings, the final selection of the infiltration rate depends on the specific building that is being designed.
Monthly Design Temperatures
July Hourly Design Temperatures

Daily Ranges for Design Day of Each Month

Figure
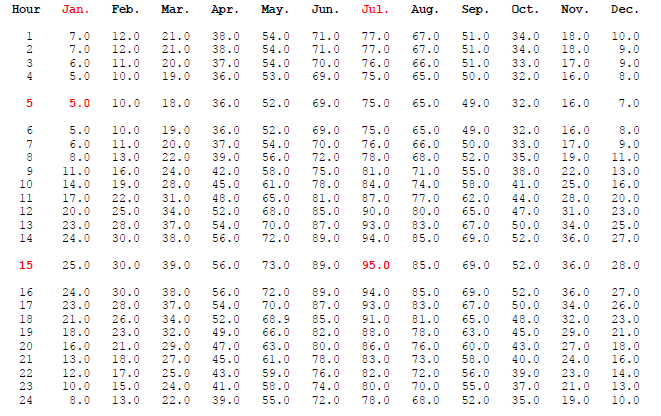
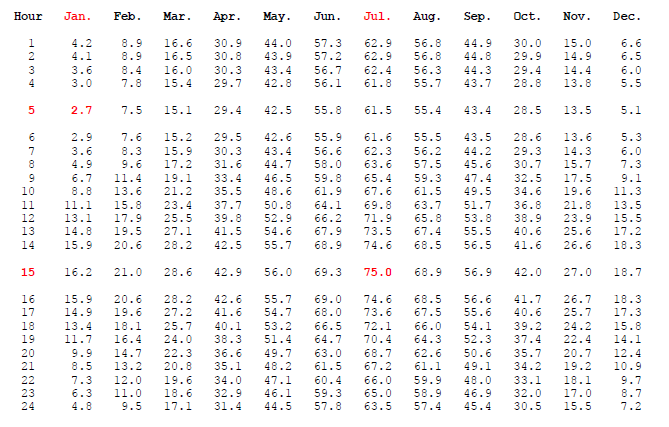
Chicago Design Day Weather (generated by HCC-V Program)
Summer Outdoor Design: 95 DB, 75 WB at 3 PM, July 21, Winter Outdoor Design: 5 DB at 5 AM, January 21.
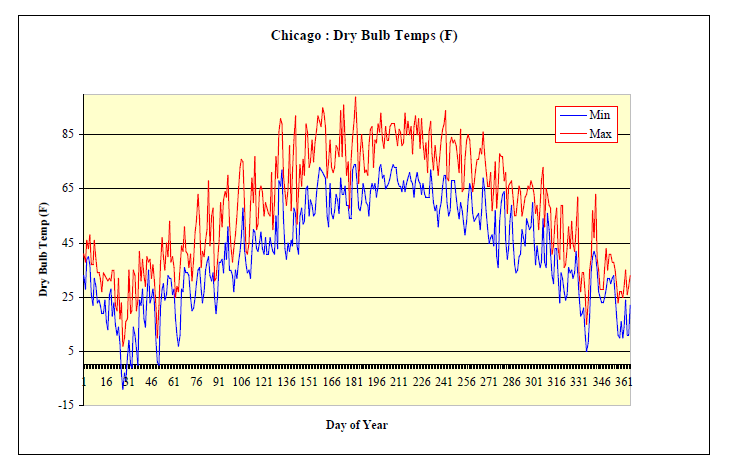
Dry Bulb Temperatures (oF)
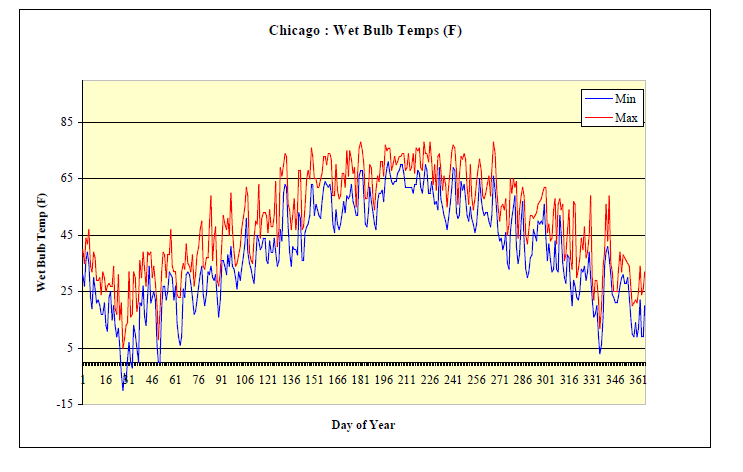
Wet Bulb Temperatures (oF)
Weather Data for Energy Calculations
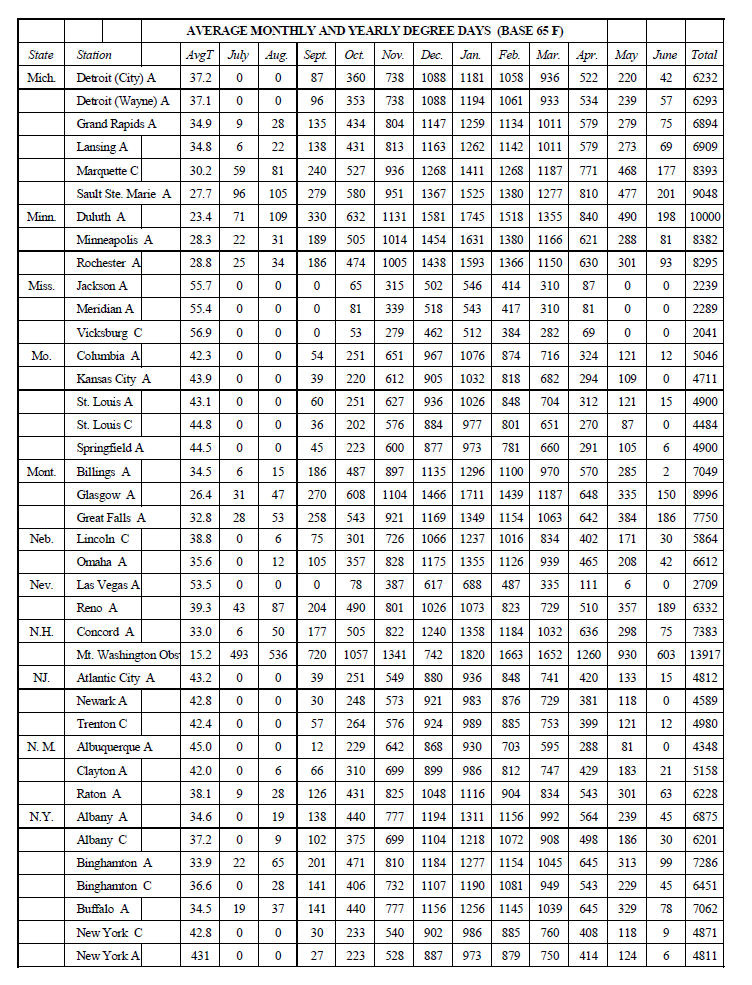
Degree Days
Heating Degree Day (HDD) is the difference between the average outdoor dry bulb temperature during the day and a base temperature that is selected above which it is assumed that the indoor space will require heating. The base or reference temperature is usually 65oF. Base reference temperatures of 60 oF, 55oF& 50oF are also used in estimating the winter energy heating loads of heated parking garages, warehouse, etc.
Typical winter indoor design conditions for spaces occupied for extended periods of time (example, offices, schools, stores, residential) are between 70oF and 75oF. A base temperature of 65oF assumes that the space will require no heating until the temperature outside falls below 65oF. This is because of the internal heat gains in the space due to occupants, lights and receptacle loads which will offset the transfer heat losses through the building envelope (walls, windows, roofs).
The symbol for HDD using a base of 65oF is HDD65. For a base of 50 oF the symbol is HDD50. The general formula is:
HDDX = X - (DBMAX + DBMIN) / 2
X = Base temperature (example 65oF)
DBMIN = Minimum temperature during the given day
DBMAX =Maximumtemperature during the given day
Note that this formula assumes that the average temperature during the day is average of the minimum and maximum. This is done to simplify the calculation. You can also use the 24 hour average. HDDX = X - (DB1 + DB2 + ----- + DB24) / 24
Example: The high temperature in Chicago on January 15 is 10oF and the low temperature is 0oF. The HDD base reference temperature is 65oF What is the HDD65. Average day temperature = (10 + 0) / 2 = 5oF. HDD65 = 65 -5 = 60
Supposing the high and low temperature in Chicago for every day in January (31 days) of a particular year was 10oF and 0oF. The HDD65 for January of that year is 31 * 60 = 1860. The heating degree days per year is the sum of the degree days calculated for each of the 365 days per year.
Typically the peak summermonths are ignored. HDD is therefore a measure of the severity of winter climate for a given location. Degree days are used to make quick estimates of winter heating energy requirements. Example:
A building envelope consists of 10,000 ft2 (Ar) of roof with Ur = 0.2, 6,000 ft2 (Aw) of wall with Uw = 0.1 and 4,000 ft2 (Ag) of single glass with Ug = 1.0. The overall composite A*U is 10000*0.2 + 6000*0.1 + 4000*1.0 = 6600. If the HDD65 for the building location is 5000 (5000*24 degree hours) then the approximate annual heating requirements for the building is 6600*5000*24 btu. If the heating value of natural gas is 1000 btu/ft3 and the cost of gas is $0.01/ft3, then the annual heating cost is 0.01 * (6600*5000*24) / 1000 = $7920.
Example: What is HDD65 for the week 11 January to 17 January (7 days) given the following:
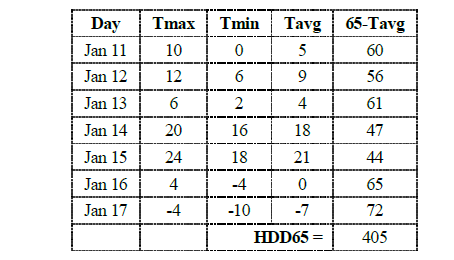
If the average day temperature is greater than 65oF, then do not add it to the total number of degree days as a negative number. The HDD65 for the example below is 40 and Not 10

Cooling Degree Days (CDD) can be thought of as being the opposite of heating degree days. CDD is the average day temperature above 65oF.
CDDX = (DBMAX + DBMIN) / 2 - X
X = Base temperature (example 65oF)
DBMIN = Minimum temperature during the given day
DBMAX =Maximumtemperature during the given day
Example: The high DB temperature in Chicago on July 15 is 95oF and the low temperature is 75oF. The CDD base reference temperature is 65oF What is the CDD65. Average day temperature = (95 + 75) / 2 = 85 oF. CDD65 = 85 -65 = 20.
Weather Data in DOE-2.1E
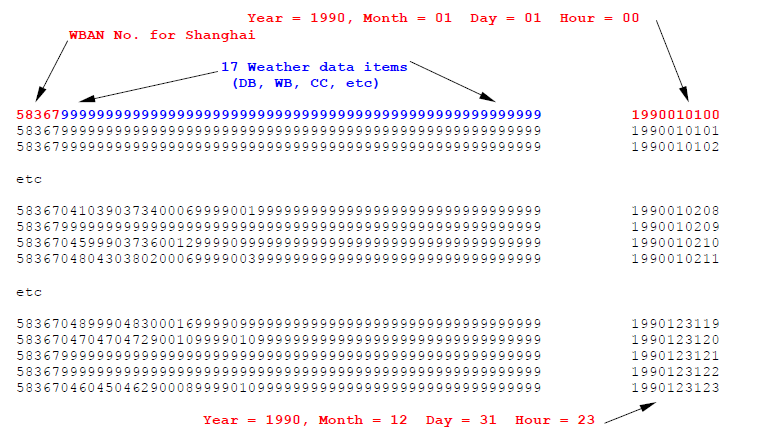
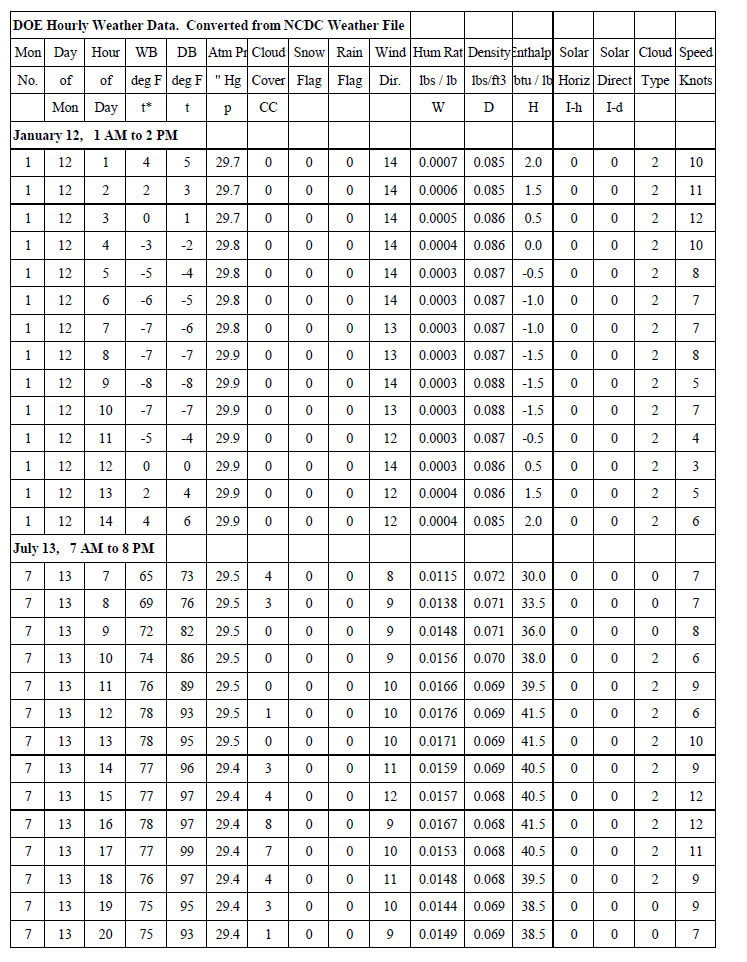
The Loads and HVAC simulations in DOE-2 require hourly weather data, which are contained in DOE-2 weather files. These weather files are created from source hourly data by the DOE-2 weather processor program doewth.
Weather Variables : The weather variables used by DOE-2 and present on the weather file are as follows. Hourly Variables : The DOE-2 weather file contains hourly data for one year (8760 hours). Leap years are ignored; all DOE-2 weather files are 365 days long. The hourly data on the weather files are:
Dry-bulb Temperature (F)
Wet-bulb Temperature (F)
Atmospheric Pressure (inches of Hg times 100)
Wind Speed (knots)
Wind Direction (compass points 0-15, with 0 being north, 1 NNE, etc.)
Cloud Amount (0 to 10, with 0=clear and 10=totally overcast)
Cloud Type (0, 1, or 2) 0 is cirrus or cirrostratus, the least opaque;
1 is stratus or stratus fractus, the most opaque; and
2 is all other cloud types of medium opacity
Humidity Ratio (lb of water per lb of dry air)
Density of the Air (lb/ft)
Specific Enthalpy of the Air (Btu/Ib)
Rain Flag (0 means it is not raining; 1 means it is)
Snow Flag (0 means it is not snowing; 1 means it is)
Hourly Solar Variables
There are two types of DOE-2 weather files: those with hourly solar values and those without. In the case of the files without solar data, DOE-2 calculates solar values using the ASHRAE clear sky model and the clearness numbers, cloud amounts, and cloud types from the DOE-2 weather file. The solar DOE-2 weather files contain the following hourly values:
- Total Horizontal Solar Radiation (Btu/hr-ft2)
- Direct Normal Solar Radiation (Btu/hr-ft2)
Monthly Variables
- Clearness Number (dimensionless). This is the ASHRAE clearness number; see, for example, p. 27.12, Figure 7, of the 1993 ASHRAE Handbook of Fundamentals.
- Ground Temperature (Rankine))
Header Data
Header record on the weather file contains the file identification, latitude, longitude, and time zone.
Source Data and Formats
Source weather data for building energy simulation programs can be broken into two major classes: historical data and typical weather years. Historical data is just "real" data: usually measured (but sometimes modeled) data from a particular location for a given period of record. Typical years are ersatz years assembled to match the long term data for a particular location using a particular statistical measure.

TRY (Test Reference Year)Weather Data from NCDC
